In November 2018, Amazon launched a new group of metrics that, for the first time, give us information about customer loyalty.
This group of metrics is called “new-to-brand” (NTB) and is available to both brand-registered sellers (though Seller Central) and vendors (through advertising platform Amazon Marketing Services (AMS) when using Sponsored Brands campaigns. These metrics are also available for demand-side platforms - DSP (for Amazon property websites, not for 3rd-party sites).
Even though it’s been seven months since this new-to-brand ad feature was launched, a lot of sellers and vendors are not aware of the existence of these metrics. As a result, they are missing out on some important information Amazon offers them that can help brands better optimize their paid marketing strategy.

Introduction of the Metrics
New-to-brand metrics give us some information about customer retention. These metrics are only available for one type of ad, Sponsored Brands (formerly Headline Search Ads).
These types of metrics are on Amazon for the first time, and they can help advertisers and help sellers or vendors to better understand their audience and who buys their products.
New-to-brand metrics also answer a question that is important to the brands: Can we see Amazon as an acquisition channel, as well as a sales channel?
These metrics can show just how many customers are being introduced to your brand on Amazon—it’s not just purchasing behavior, as it’s also driving sales.
This data can help brands determine their ad spend as well. If a large percentage of customers are NTB, perhaps you’ll be prepared to accept a higher Advertising Cost of Sales (ACoS) knowing that this effort is introducing new customers to your products.
Advertisers will receive performance metrics such as:
- Percentage of orders NTB—The percentage of total orders that are new-to-brand orders.
- Percentage of sales NTB—The percentage of total sales (in local currency) that are new-to-brand sales.
- NTB orders—The number of first-time orders for products within the brand over a one-year lookback window.
- NTB sales—the total sales (in local currency) of new-to-brand orders.
Amazon will determine if an order is new to your brand by reviewing the last 12 months of a shopper’s purchase history. If a shopper has not purchased from your brand within the first 12-month lookback window, the order is considered new to the brand;
New-to-brand data is not available for Sponsored Products at this time. Data is available for Sponsored Brands from Nov. 1, 2018. If you select a start date earlier than Nov. 1, your new-to-brand metrics will be calculated using Nov. 1 as the start date.
Where Can Brands Find Them
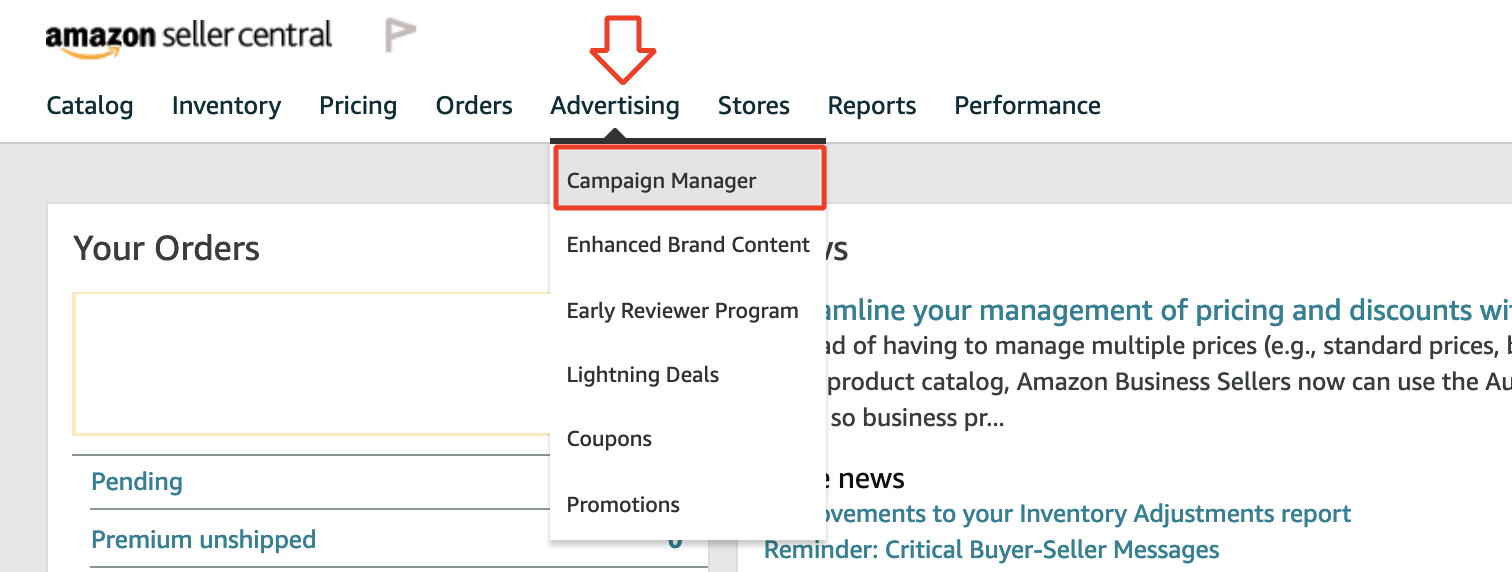
To find these new metrics, you’ll simply need to log in to your Seller Central account/advertising platform (AMS) and go to your Campaign Manager. I’m going to show you step by step how you can find them:


2. Click “+ Add metric,” above the customizable chart.

3. Select the NTB metrics—right now they have this “new” badge.

4. Once selected, you’ll be able to also create a chart using up to two NTB metrics to display. As mentioned prior, Amazon will show us only data starting with Nov. 1, 2018.
How These Metrics Can Help Advertisers, Sellers, and Vendors
Using different strategies, these metrics will look different, and I’m going to show you two strategies you can apply that will have different advertising objectives.
Acquire More New-To-Brand Orders
If you want to build up a strategy where your advertising goal is to reach more new-to-brand orders, then you should consider targeting keywords that a lot of people are searching for (high search volume keywords).
This helps you maximize the number of potential customers who will see your ad. Make sure your bids are high enough so your ad gets displayed.
When you use this type of keywords, your cost per conversion can be higher. However, if you sell consumables—for example, paper cups, dental floss, or even gourmet foods—some of the new-to-brand customers can come back and buy from you organically, and you can look at the lifetime value of the ad spend using these metrics.
Here is an example of how the NTB metrics look like when using this strategy:

For this type of strategy, depending on your product’s type, the percentage of orders NTB and the percentage of sales NTB can vary anywhere from 80% to 97%.
Reach Customers Familiar With Your Brand
If your goal is to reach customers who are familiar with your brand, you should consider launching a branded keywords campaign. This type of strategy is also used as a defense strategy—if you’re not bidding for your branded terms, a competitor might do that.
These types of keywords usually have a lower number of impressions and clicks, a lower cost per click and ACoS, and higher conversion rates, and the new-to-brand orders can vary anywhere from 30% to 70%.

Looking at these screenshots, it’s clear to see that the differences between these two types of strategies—NTB percentage of sales and NTB percentage of orders—are huge.
Furthermore, for the same timeframe, we have a considerably lower number of impressions and clicks for the branded keywords campaign and a higher CPC and ACoS for high search volume campaign.
These are just the most common examples, but there are a lot of approaches that you can implement to take advantage of these new metrics.
More than that, knowing what products are purchased frequently by return users and what is purchased by new users can shape how you target people and what products you focus spending on.
The Opportunities of New-To-Brand Metrics
New-to-brand metrics are a new and exciting feature that we’ve never seen before on Amazon. It allows advertisers to measure orders and sales of products generated for the first-time customers of your brand on Amazon.
For the first time, we are able to actually see how many sales you get through Amazon ads that were from brand-new customers who haven’t bought from you before.
Set up your advertising goal, and take action toward it. With the help of the NTB metrics, find out where your brand places when it comes to recurring buyers on Amazon, and build up a paid marketing strategy that will help your brand get introduced to even more new customers.

More about NTB metrics?
Tune in for episode 28 of Bobsled's Ecommerce Braintrust podcast to get more insights from our team.
Tagged: PPC Advertising, Seller & Vendor Central, Amazon Display Advertising
.png)

