.png)
Please note this is an older article. We advise you to check out the 2022 version here.
Winning brands can all agree on one thing; Amazon is becoming increasingly pay-to-play. To get to the top of your category, you need to be bold with Amazon PPC advertising. There are no shortcuts to market share domination.
But do you sometimes worry that you’re paying too much to play? Or maybe you’re actually underspending on Amazon PPC, and this is limiting your return?
In today’s article, Bobsled’s Director of Marketplace Strategy & Insights Stefan Jordev has outlined some ways in which brands can ‘kick the tires’ in respect to their Amazon PPC spend. Each brand will obviously have a unique set of criteria that informs how much they want to invest. But there are common pitfalls Stefan has identified after analyzing hundreds of accounts.
Read on to learn more!

Start with historical data
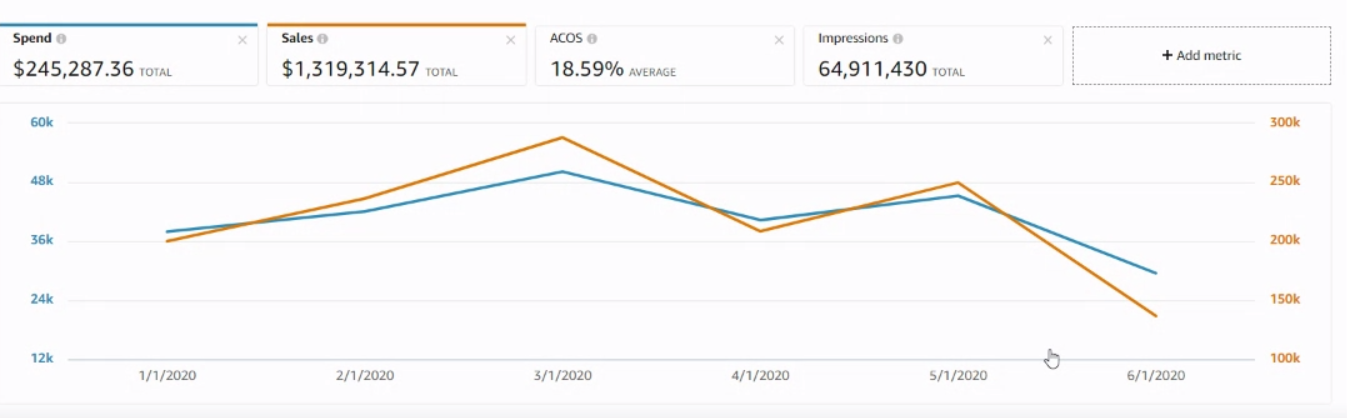
Every brand will see peaks and valleys when it comes to Amazon revenue over a calendar year. Most sellers will see the vast majority of sales occur in Q4. Brands with summer orientated products may see stronger sales during the warmer months.
Take a look at how your PPC spend was divided over the year. Total ad spend should roughly correlate with total revenue. For example, if you generated 50% of your total Amazon revenue in Q4, this should translate to approximately 50% of your total ad spend taking place in Q4. There are sometimes obvious reasons why revenue and ad spend doesn’t correlate perfectly (e.g. stock outs, launching lots of new products etc), but generally speaking, it’s a good rule of thumb.
If your PPC spend doesn’t move in line with seasonal revenue trends, there’s a good chance your campaigns are on autopilot. This means you could be spending too much during quiet periods, and not enough to capitalize on increased traffic during peak seasons.
Category benchmarking
Bobsled works directly with the Amazon Advertising team on behalf of our clients in order to benchmark anticipated PPC performance for each product category. Our ad tech partner Pacvue also provides us with valuable category performance data in relation to traffic volume and standard CPCs.
This category specific data is invaluable for determining how to allocate your Amazon PPC budget.
“Without category benchmarking you are spending within a vacuum,” explains Stefan. “We have a wealth of client ad data so we know straight away when spend levels are off, but individual brands don’t have this luxury, and need to seek out category insights. Once you have established what ‘normal’ looks like for your category, you can work backwards to see how your spend and ROI stacks up versus the competition.”
Ad type ratio
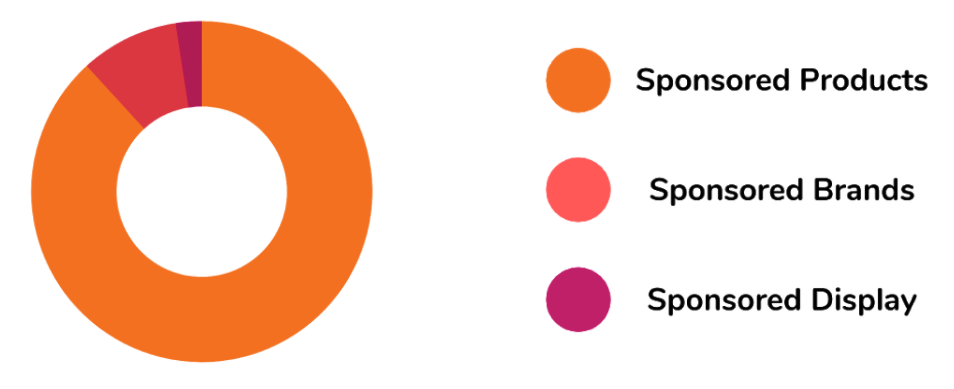
At Bobsled we find top performing advertising accounts typically have the following ad type ratio:
- 75% of spend on Sponsored Products
- 20% of spend on Sponsored Brands
- 5% of spend on Sponsored Display*
*Bobsled anticipates more budget gradually going across to Sponsored Display in the near future due to the extra features now available with this ad type.
If your ad type ratio is remarkably different to the above 75/20/5 split, there’s a good chance your strategy has major inefficiencies.
Why Bobsled?

- An Amazon-focused digital agency established in 2015
- 40 team members who share best-practices across industries, programs, and processes
- Works with 70 mid-market Vendors & Sellers across Amazon’s key western markets
- Thought leaders in the space, including a Weekly Forbes column by CEO Kiri Masters, and named by Business Insider as one of 18 top Amazon solution providers
- Direct Partner relationship with Amazon Advertising, providing early access to beta programs, benchmarks, and best practices
Sponsored Products automatic vs manual ratio
We find top performing Sponsored Products campaigns typically have the following auto vs manual ratio, approximately speaking:
- 25% of Sponsored Products campaigns are Automatic
- 75% of Sponsored Products campaigns are Manual
If your auto vs manual ratio looks remarkably different to the above 25/75 split, there’s a good chance your strategy has major inefficiencies.
💡 Check out How much should I spend on Amazon PPC? [2021 Update]
Share of Shelf AKA Share of Voice: incorporating your brand awareness goals
A Share of Shelf analysis highlights which brands and products can be found on page one for particular keywords. Such reporting looks at which brands are occupying both paid and organic placements.
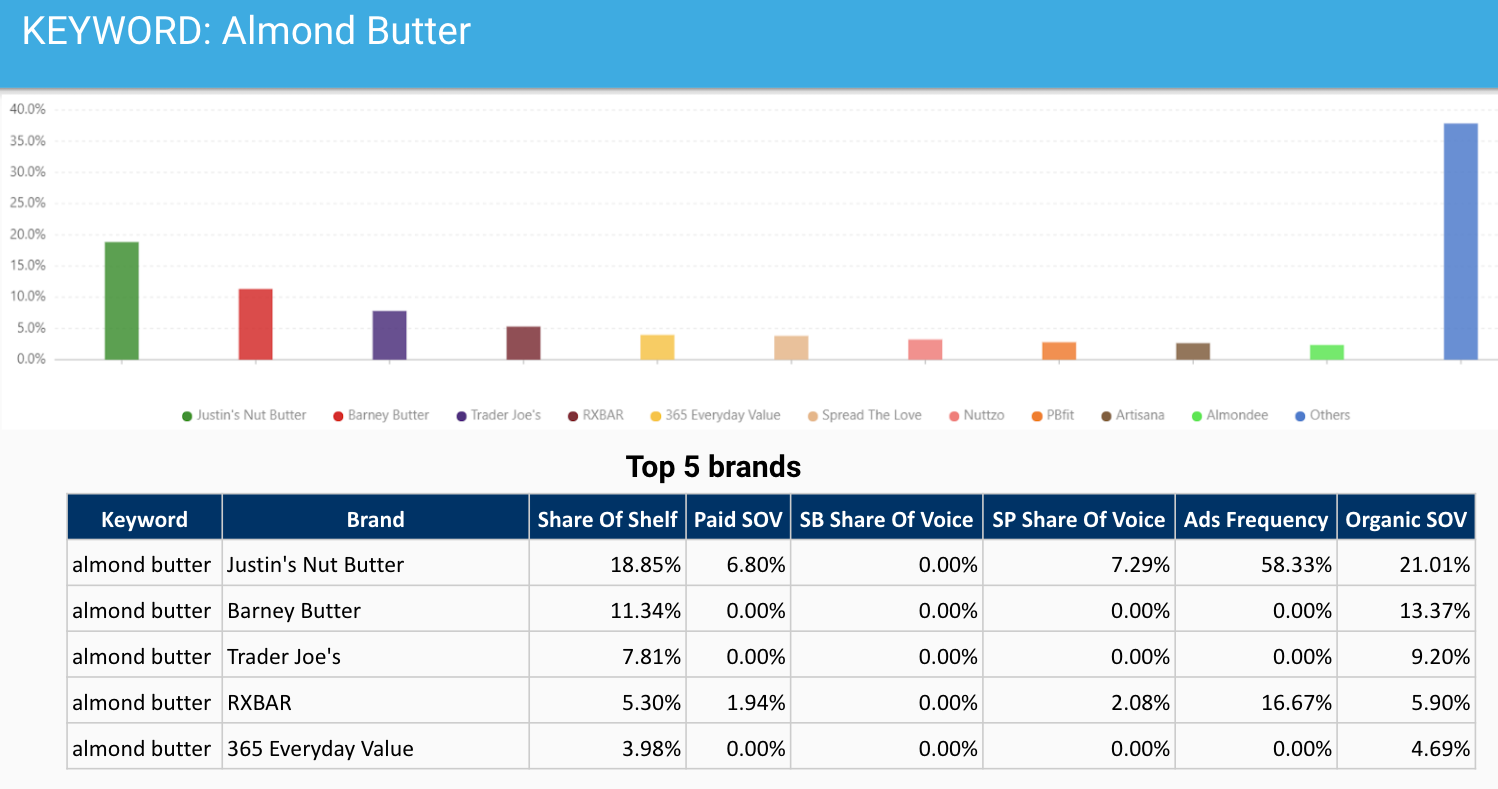
Above: Sample of an Amazon Share of Shelf analysis for the search term ‘almond butter’
Brands should determine which search terms are most critical for market share domination over the long term, and run regular Share of Shelf reports to see how their products are performing versus direct competitors. If a brand is underperforming from an organic perspective across these critical search terms, they may need to increase their PPC spend so they can effectively compete.
💡 Check out Amazon Share of Shelf: Benchmarking Performance
Other factors that can commonly impact Amazon ad spend
- Lack of universal negative keywords. Using a list of universal negative keywords brands can prevent unwanted ad spend before new campaigns launch. If you don’t have a list of universal negative keywords, you are probably overspending with your auto campaigns.
- Bid management optimization with tech solutions. Even brands that manually optimize bid management every week can’t compete with AI powered tools. Our recommendation; utilize a bid management tech solution to automatically optimize bids on a daily level with defined rule updates.
- Bid type ratio not optimized. Bobsled recommends experimenting with all 3 bid types, but it’s likely certain bid types will perform better than others. Review your Sponsored Products Placement report and implement strategy updates where necessary.
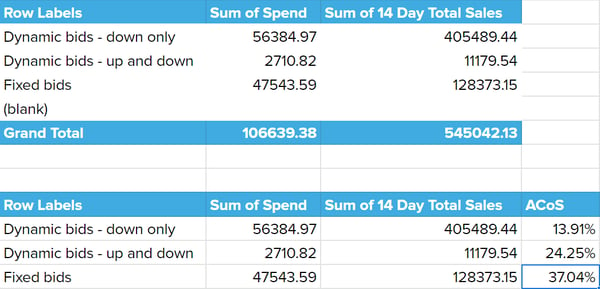
Above: For this account, there’s enough data to suggest ‘Fixed’ and ‘Dynamic - Up & Down’ bid types need bidding strategy updates
Map out your optimization strategy
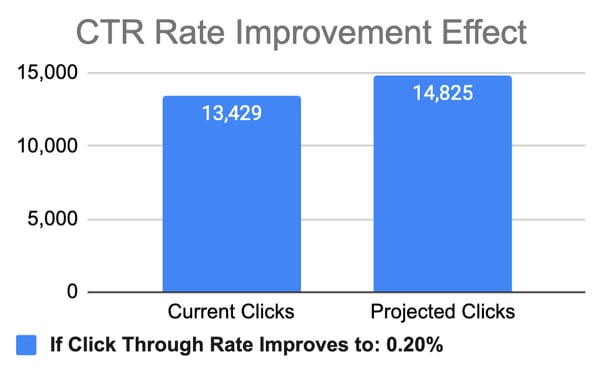
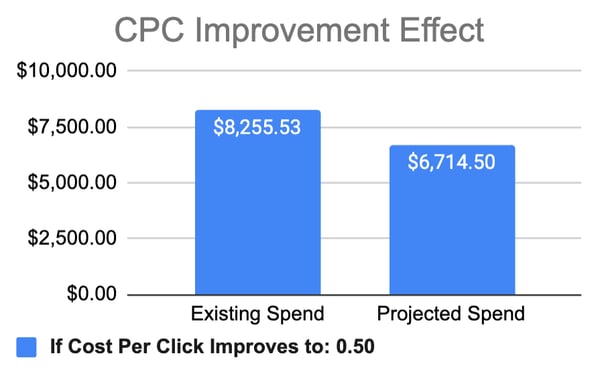
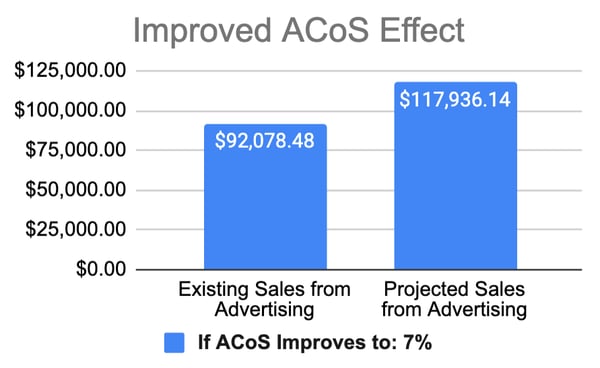
“The next is to use all of the above data points to map out a 90 day optimization strategy,” says Stefan. “At Bobsled we analyze current performance and make concrete predictions about how we can improve Click Through Rate, Cost Per Click and ACoS. Rather than ongoing tinkering without a plan, this gives us a tangible goal to work towards.”
INTERESTED IN AN AMAZON PPC AUDIT?
Book a free consultation with one of our experts below.

Tagged: PPC Advertising, Amazon Account Management