.png)
Benchmarking performance is a critical part of scaling on Amazon. In this blog post series, we’re going to share some key data points that will help refine your 2020 marketing strategies.
Unbelievably, we’re already at the tail-end of January, and at this point, the Holiday season seems nothing more than a distant memory.
But at the risk of making you feel a little sentimental, we’re going to take a trip down memory lane. To be more specific, we’re going to be sharing some useful Amazon performance data points from December 2019.
At Bobsled, we’re always trying to win our clients more market share. And in order to develop effective growth strategies, we keep very close tabs on both macro and category-specific trends.
In this blog post series, we’re going to be sharing finalized stats and figures from the month prior that will give context to your brand’s performance on the Amazon marketplace.

How Did Bobsled Acquire The Following Data?
Bobsled is an official partner of Kenshoo, a marketing technology leader. We utilize Kenshoo’s suite of services within Amazon accounts under our management in order to automate and optimize performance.
At the end of each month, Kenshoo provides us with core KPI performance metrics for some select Bobsled clients. Kenshoo also provides Bobsled with category-specific statistics that are compiled from a broader sample of anonymized data. As a team, we analyze and interpret these data sets internally, and moving forward, we’ll start sharing our collective analysis on the Bobsled blog.
Typically, it takes around 10 days for all of the data from the month prior to settle, so moving forward you can expect each data recap to drop around the middle of each month. But, considering that the first half of January is still vacation time for a lot of our audience, we wanted to wait an extra week to release this premiere installment of the ongoing series.

What Happened On Amazon In December 2019?
Nerd-ing out on data is the Bobsled team’s bread-and-butter (we are digital marketers after all). But we also keep abreast of all the headlines so the numbers make more sense.
In case you missed them, here are the biggest Amazon news stories that broke during December 2019.
- Active sellers have grown to 1.16 million on the Amazon EU marketplaces, according to data released by Marketplace Pulse.
- Amazon blocked Sellers from using FedEx Ground for Prime Shipments, impacting Seller-Fulfilled Prime users specifically.
- Amazon’s B2B unit is growing faster than its Retail and Amazon Web Services operations, according to a RBC Capital Markets Analyst. They predict that Amazon Business will surpass $30 billion in revenues by 2023.
- Amazon customers left more negative feedback in December 2019 compared to previous years, according to analysis by Marketplace Pulse. Most of the negative ‘seller feedback’ reviews complained about receiving the order late or never receiving it at all. There’s a spike in negative feedback every Christmas, but in 2019 the spike was more pronounced.
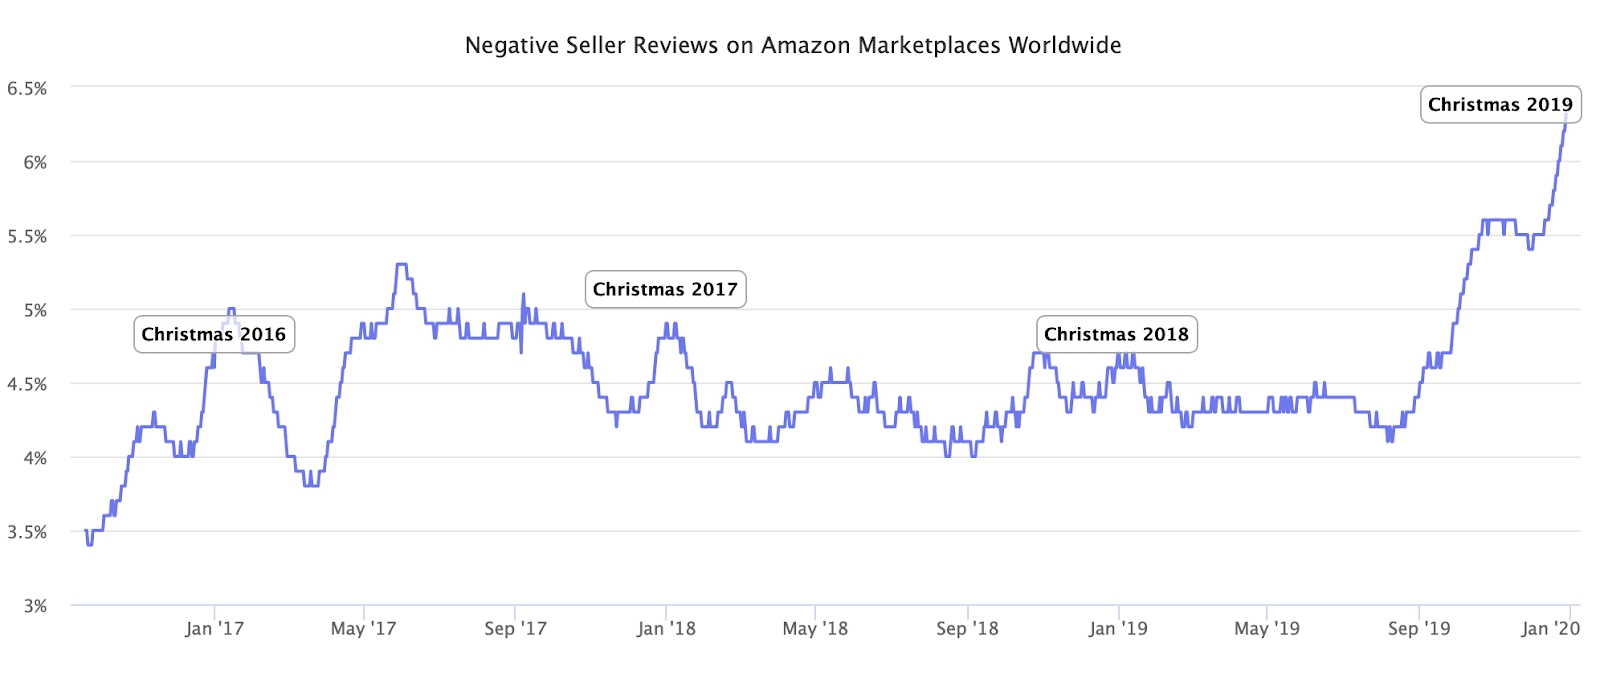
Image source: Marketplace Pulse
December 2019 Statistics
The following statistics are compiled from a sample of anonymized data from 36 Amazon Bobsled accounts across 6 marketplaces.
Main KPIs
Impressions
| December 2019 | November 2019 |
| 298,669,934 | 218,946,304 |
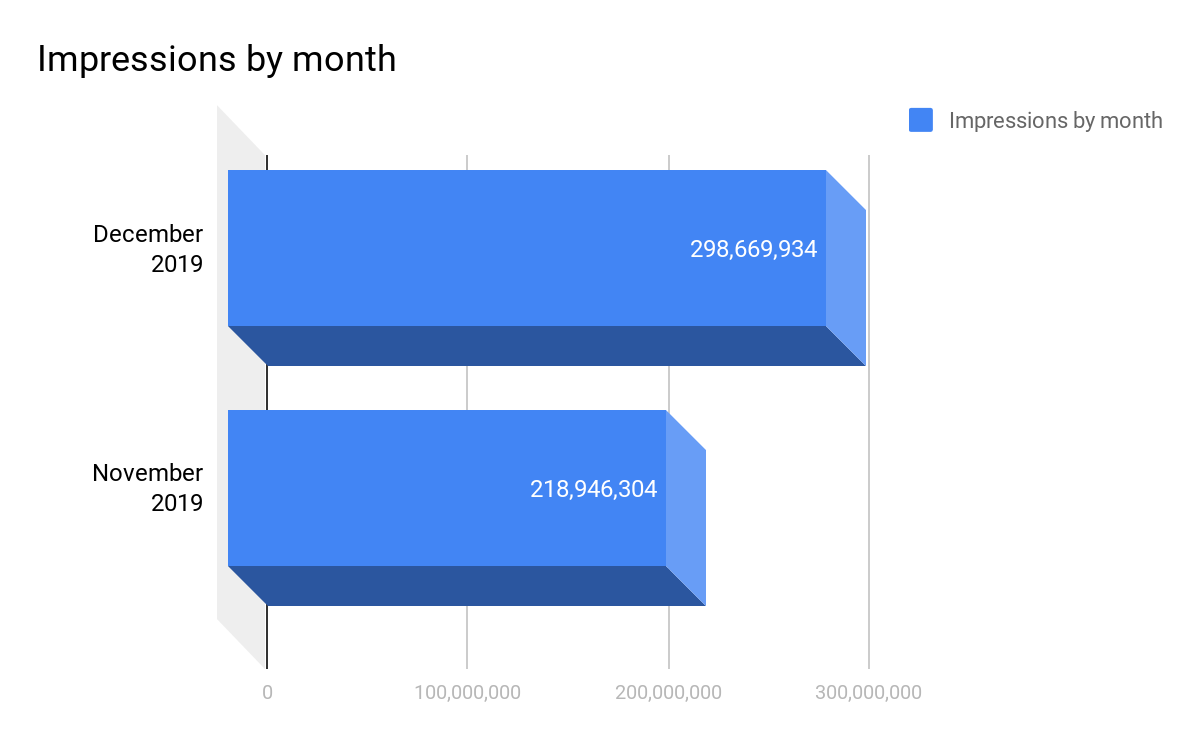
December saw an increase of clicks across all accounts by an average of 36.41%. This is expected, as historic data suggests December is the month Amazon.com receives most visitors within the year.
Clicks
| December 2019 | November 2019 |
| 931,058 | 733,057 |
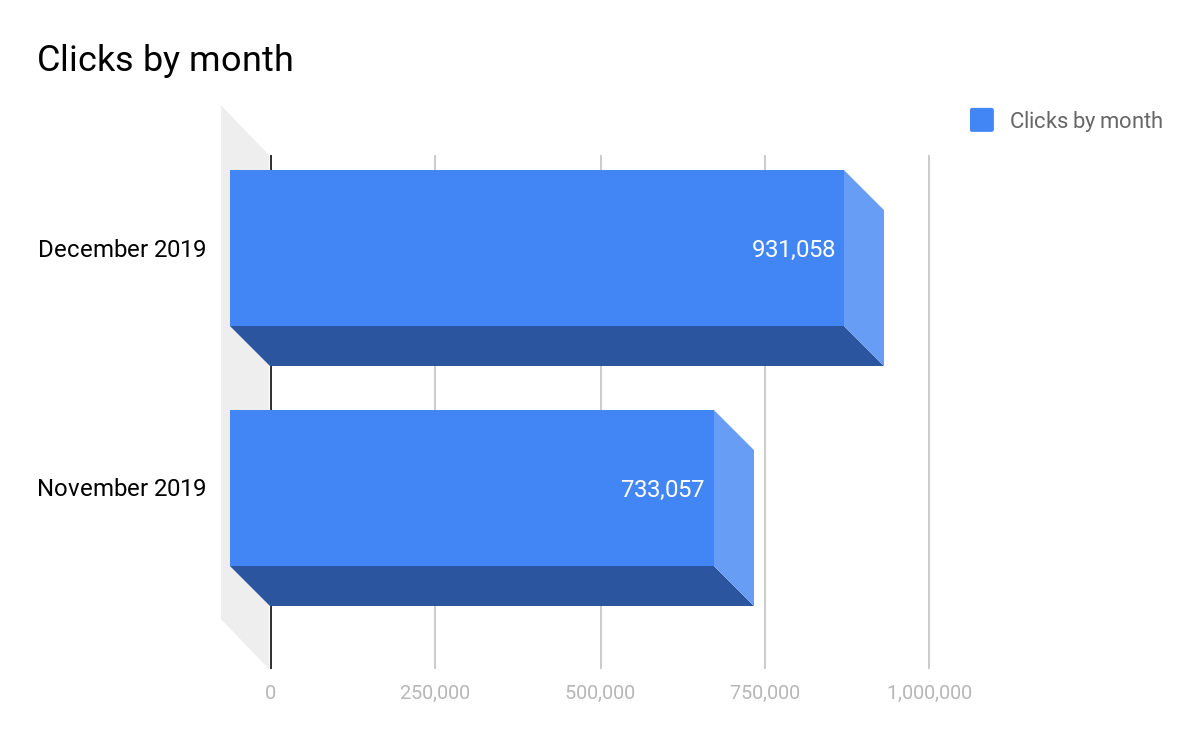
Clicks in December increased by 27.01% compared to November.
Average CPC
| December 2019 | November 2019 |
| $0.64 | $0.53 |
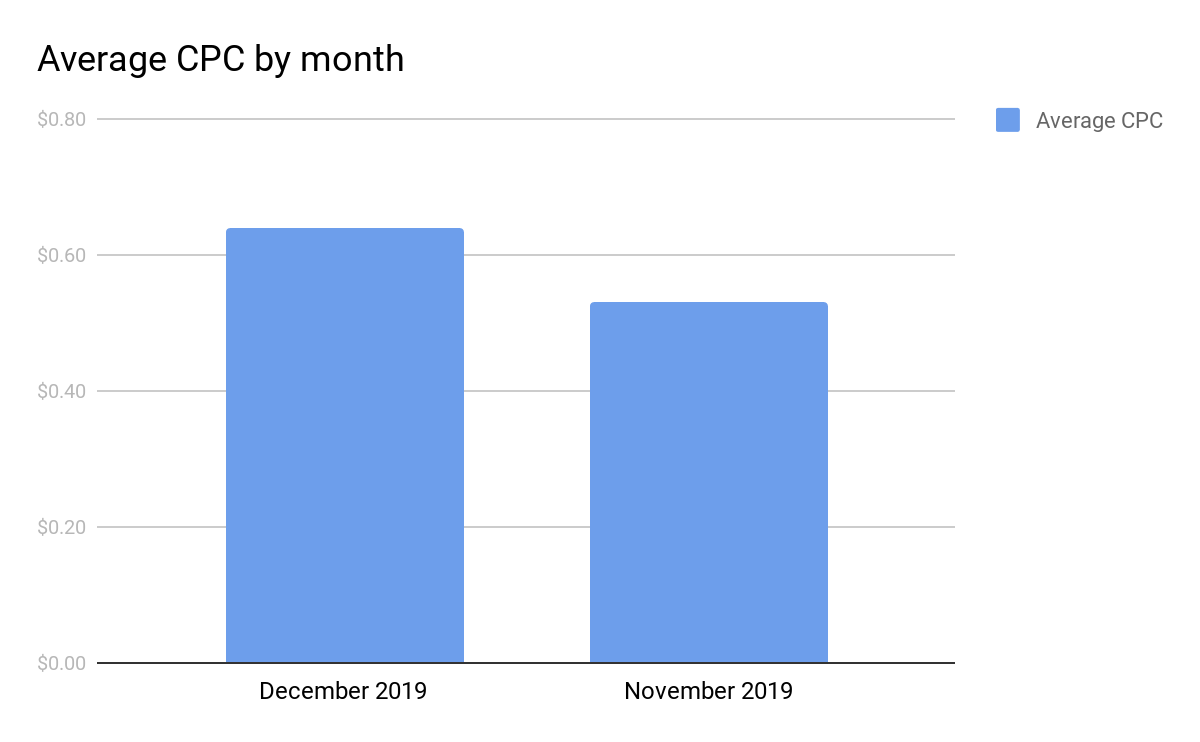
Average CPC has increased by 20.75%.
Conversion Rate
| December 2019 | November 2019 |
| 8.27% | 7.28% |
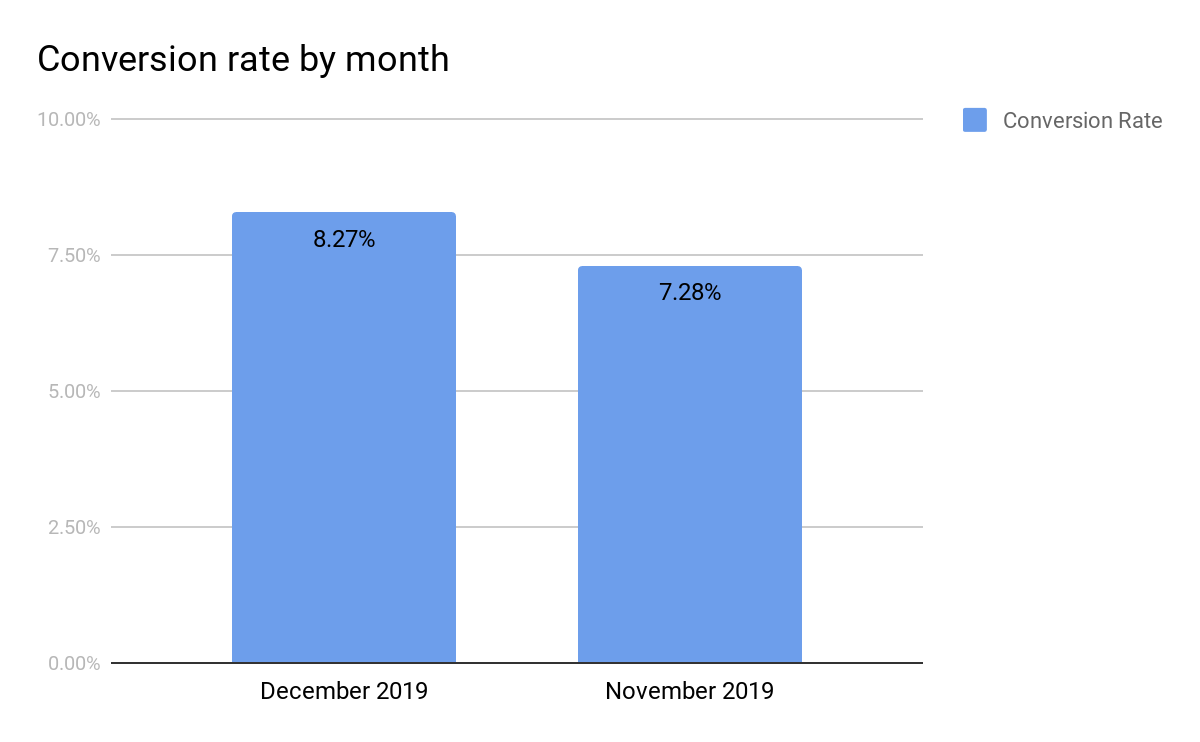
Conversion rate in December improved by 13.6% compared to November.
Theoretically speaking, conversion rate is a neat coalescence of the customers’ desire to purchase and the attractiveness of the offer in terms of price and benefits. The increased conversion rate observed in December illustrates this point perfectly. In December, potential customers are doing last-minute Holiday shopping online, they have more budget to spend compared to other months, and many sellers are utilizing a variety of Amazon Promotions (coupons, Lighting Deals, percentage off etc) in order to maintain post-Turkey 5 sales momentum.
Category Specific Data - Apparel, Grocery & Beauty
Bobsled has high-level experience within Apparel, Grocery and Beauty, and we follow trends within these categories very closely.
The following statistics are compiled from a broad sample of anonymized Kenshoo data; 34 Apparel accounts, 77 Beauty accounts and 62 Grocery accounts (see ‘Count Active Profile’ row of below table).
December 2019 Stats - Apparel, Grocery & Beauty
| Metric | Apparel | Beauty | Grocery |
| Impressions | 1,157,146,070 | 1,307,067,398 | 537,324,771 |
| Clicks | 4,366,565 | 4,033,732 | 2,265,036 |
| Spend (usd) | $2,802,837.56 | $9,097,760.43 | $3,020,313.62 |
| CPM | $2.42 | $6.96 | $5.62 |
| CTR | 0.38% | 0.31% | 0.42% |
| CPC | $0.64 | $2.26 | $1.33 |
| Conversions | 774,529 | 1,044,274 | 503,694 |
| Conversion Rate | 17.70% | 25.90% | 22.20% |
| CPA | $3.62 | $8.71 | $6.00 |
| Revenue (usd) | $34,098,032.53 | $20,395,705.35 | $10,817,552.88 |
| ROI | $12.17 | $2.24 | $3.58 |
| Count Active Profiles | 34 | 77 | 62 |
For the Bobsled team, the most intriguing part of the above data set was the incredible $12.17 average ROI for the Apparel category. The above Apparel accounts spent just over $2.8M total on advertising during December 2019, and this resulted in sales of just over $34M, a much better advertising return than both the Beauty and Grocery accounts.
But, there may be an obvious explanation for this. The data set only included 34 Apparel accounts, compared to 77 in Beauty and 62 in Grocery. Therefore, a couple of successful Apparel outliers who had extremely efficient advertising campaigns that generated huge revenue in December 2019 could’ve skewed the monthly average for the entire category. There may be similar outliers within the Beauty and Grocery accounts, but their impact would’ve been less pronounced, due to the fact that the total Count Active Profile profile for both categories was approximately double that of Apparel.
This illustrates an important lesson when it comes to benchmarking; always interpret data in context, and don’t jump to hasty conclusions about your own performance (or lack thereof), especially when you’re analyzing anonymized figures.
What Does This Data Mean For Brands?
The YOY increase of overall impressions and clicks noted in the final month of Q4 2019 is not surprising. However, brands should be paying extra attention to Marketplace Pulse’s claim that approximately 6% of Amazon’s worldwide customers were not happy during the 2019 Holiday season.
In the US market, the negative review rate was 3.75% for most of the year, but this spiked to 5.6% during the Holiday season. Products can receive negative reviews for a variety of reasons, but the main problems in December 2019 appeared to be shipping delays (order did not arrive in time) and incorrect item (wrong size/color or different product altogether). Such negative reviews can cause serious reputational damage for brands.
Brands should obviously be paying very close attention to their shipping and inventory management processes, especially during peak Holiday seasons. If you notice a downturn in sales during Q1 2020, this may be the direct result of your poor shipping and/or inventory management performance in December 2019.
Need More Insight?
We hope you enjoyed the first of our monthly data recap series! The next installment will go live on Thursday February 13th - sign up to our mailing list so you don’t miss a thing.
Need more help analyzing your December 2019 Amazon data and locking down your strategy for 2020? Click the button below, complete the contact form and a Bobsled team member will be in touch to schedule a consultation.

Tagged: Clothing, Amazon Account Management, Grocery & Gourmet Food, Beauty